
Real statistics, not prose
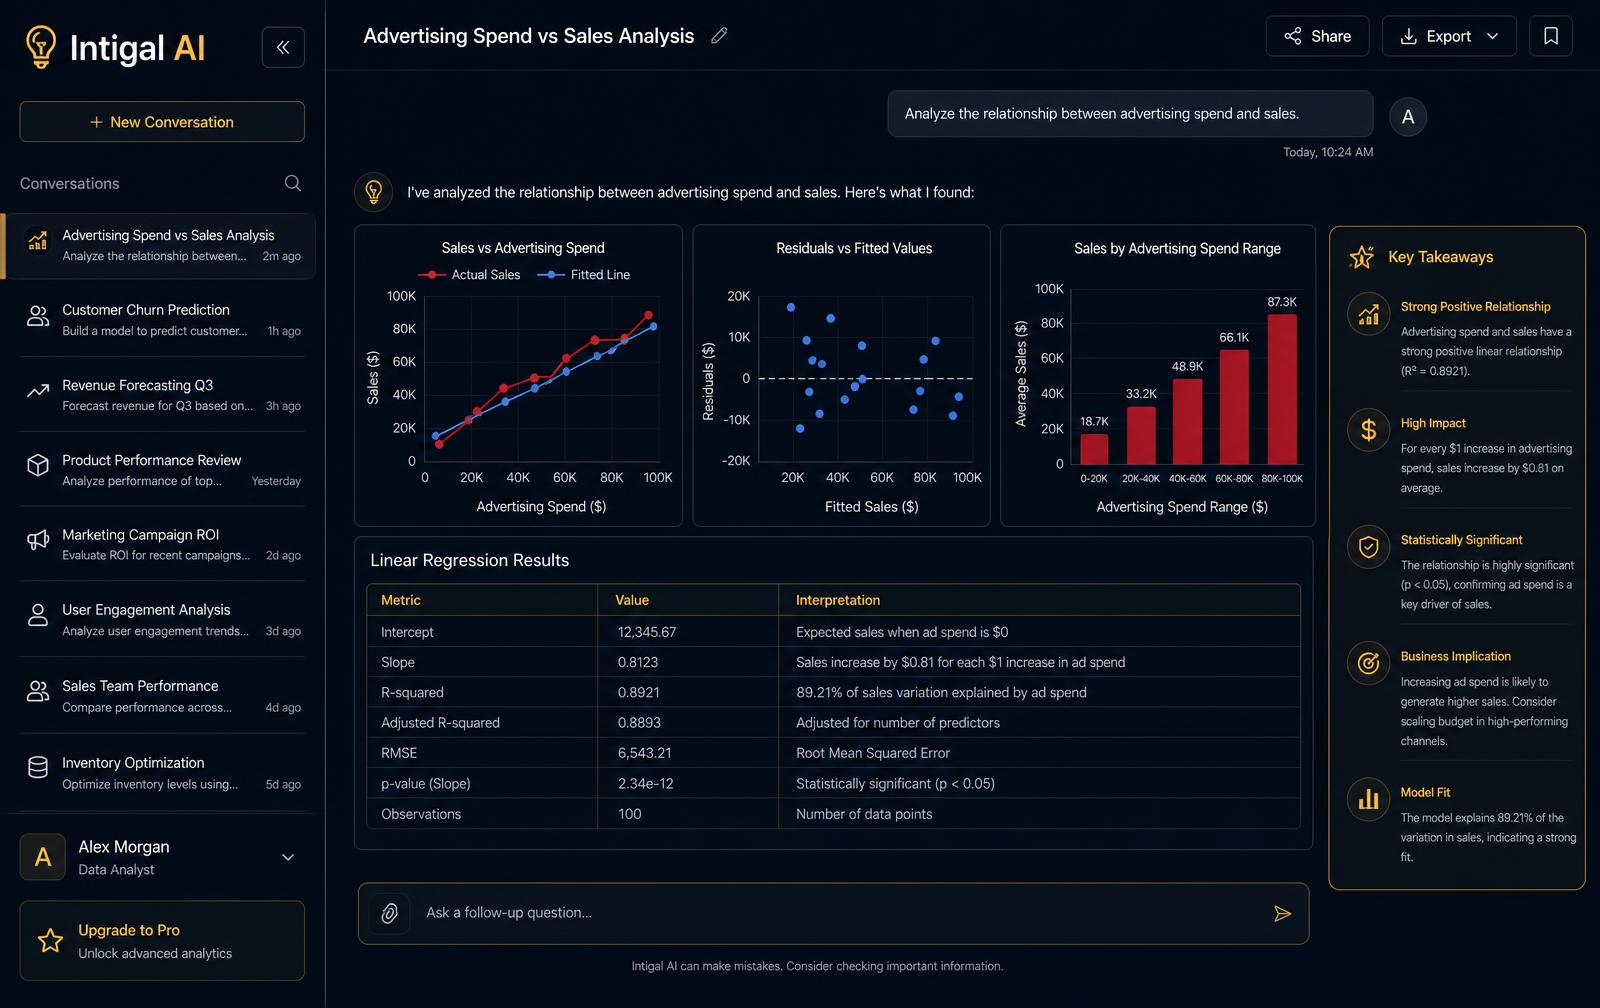
Regressions, t-tests, ANOVA, correlations and forecasts are computed by a deterministic engine and then explained — every coefficient is reproducible.
AI analytics for data, finance & market research
Upload a spreadsheet, connect a database or point Intigal AI at a market. Ask in plain English and get computed regressions, forecasts, charts and decision-ready reports — no data team required.
Encrypted in transit and at rest. Your data never trains shared models.
Capabilities
From raw file to defended recommendation — profiling, modelling, visualisation and the write-up, in a single threaded conversation.
Regressions, t-tests, ANOVA, correlations and forecasts are computed by a deterministic engine and then explained — every coefficient is reproducible.
Millions of rows across CSV, Excel, JSON and live SQL.
Switch chart type, axes, palette and series inline — then export.
Branded, paginated reports built in the background with your charts and tables rasterised in.
Drop in a dashboard screenshot or scanned table and it works from the pixels.
Ask the question; get the query, the result set and the caveats.
Row-level isolation, retention controls and self-hosted paths for regulated teams.
Data & big data
Intigal AI profiles every column, flags missing and skewed data, proposes the cleaning steps and then answers your actual question — with the working shown.

Finance
Ratios, cohort economics, scenario models, risk and portfolio analysis — computed, stress-tested and narrated for the people who sign off.

Market research
Turn survey exports, sales history and public signals into segmentation, market sizing and competitive positioning you can defend in a room.

How it works
Step 01
Drag in CSV, Excel or JSON, connect SQL, or paste a screenshot of a dashboard.
Step 02
The agent profiles the data, picks the right test and computes it — then explains the result.
Step 03
Export a branded PDF, a results CSV or a customised chart straight from the thread.
In the thread
Which cost line broke our gross margin last quarter?
Logistics rose 38% QoQ and explains 71% of the 4.2pt margin drop. Regression on unit economics: coefficient −0.19 per shipment (p < 0.001, R² = 0.84).
Who uses it
It replaced a two-week analyst cycle with an afternoon. The regression output matched what our quant produced by hand.
The PDF export is what sold my board. Charts, tables and the caveats, all branded, in one click.
I can finally interrogate survey data without waiting for someone to write SPSS syntax for me.
Three credits a day, free forever. Upgrade when the answers start driving decisions.